
Residential Sales Value Portal
Welcome to Lambert Smith Hampton’s Residential Sales Values Portal (RSVP), your visual guide to residential per sq ft values across the UK. The map utilises a variety of statistics to illustrate key residential pricing indices at the local authority level. Simply click on the map below to assess residential values, property prices and prevailing affordability levels across the UK.
Notes: Right click to zoom in. If map values are not being displayed, please delete cache from your browser
| VARIABLE | TIME PERIOD | MEASURE | LEVEL MEASURMENT | SOURCE |
| AVG PER SQ FT | Jan 2024 | Average price per sq ft for property | Local Authority | LSH Research, Property Data |
| AVG PER SQ FT LOCAL AUTHORITY RANGE |
Jan 2024 | Maximum and minimum average price per sq ft of postcode sectors within local authority | Local Authority | LSH Research, Property Data |
| AVG PROPERTY | Q4 2023 | Average transaction price for property | Local Authority/Council | Land Registry, Ulster University |
| AVG PROPERTY PRICE 12 MONTH CHANGE | Q4 2022-Q4 2023 | 12 month % change in average transaction price for property | Local Authority/Council | LSH Research |
| INCOME PRICE RATIO | 2023 | Ratio of median house price (existing dwellings) to median gross annual (where available) residence-based earnings | Local Authority | ONS |
PRICES FALL MORE SHARPLY IN LONDON
Average UK residential property prices fell by 1.4% in 2023, reflecting the impact of rising interest rates on borrowing and a more challenging economic environment generally. The fall was however slightly less marked in the second half of the year, with average prices falling by 0.6% in H2, compared with a fall of 0.8% in H1.
Greater London was the main drag on growth in H2, with average residential property prices falling by 2.8% over the period. Despite this, the capital nonetheless remains by far the most expensive area of the UK, with average values equating to £760 per sq ft. This is 85% higher than the average for the South East, the second most expensive region of the UK.
Beyond Greater London and the UK’s southernmost regions, average values are relatively uniform across the other regions of the UK. The North East is home to the lowest average values, reflecting £171 per sq ft, while prices in Wales, Yorkshire and The Humber, the North West and Midlands are within a relatively tight range of £214 to £262 per sq ft.
At a more local level, many parts of the UK bucked the wider trend and recorded a degree of price growth during in H2 2023. Some of the most significant price increases over the period were apparent in relatively rural parts of the UK. Rossendale, in the North West, was the strongest performer among the UK’s 360 districts, recording price growth of 11%.
At the other end of the scale, some of London’s most expensive districts appeared especially sensitive to the higher interest rate environment and saw the sharpest price falls in H2, most notably the City of London, where average prices fell by a colossal 19%.

Unsurprisingly, London has the highest property price to income ratio, averaging 12.5, with Camden as the district with the highest ratio of 19.4. In contrast, the North West demonstrates a much more favourable level of affordability, with a regional price to income average ratio of 6.3. Burnley shows the lowest ratio of anywhere in the UK, standing at 3.5.
SUB-REGIONAL VALUE VARIANCE
The spread of residential values within the UK regions is tightest in the North East, with the most expensive district of North Tyneside (£211 per sq ft) commanding a modest 51% premium over the region’s least expensive district of Hartlepool (£140 per sq ft). The second lowest intra-regional variation between districts is in the South West, where the average price spread is 57% between the most expensive and least expensive districts, namely Bristol and Plymouth respectively.
Conversely, and beyond the extremes associated with Greater London, the East of England exhibits the highest regional spread in average pricing between its constituent districts, standing at 169%. This is likely due to significant variability in commutability with central London, with The East region’s most expensive district of St Albans (£620 per sq ft) being far better connected with major population centres than the least expensive area of Fenland (£231 per sq ft).

Contrasting Corrections: Resilience of residential vs commercial values
While the UK housing market endured a modest price correction in recent times, its scale has not come close to that seen in the commercial property market. This could have important implications for investor and developer decision-making over the next cycle.
HOUSE PRICES TICK DOWN IN 2023
According to official ONS figures, average UK house prices fell by 1.4% across 2023, partly offsetting strong growth of 9.8% in 2022. As the map below illustrates, there were however notable contrasts in price movements at both the regional and district level. The North West and West Midlands were the only regions to see an increase in average prices during 2023, rising by 1.2% and 0.3% over the period respectively. In contrast, London saw the sharpest fall, with average prices falling by 4.8% over the year.
STABILITY REAPPEARS
More recent evidence is indicative of a shift towards a stabilisation of prices in 2024. Hampton’s latest forecast expects UK house prices to remain unchanged (i.e. flat growth of 0.0%) over the year, reflecting expected cuts to the base rate and improvements in mortgage rates. There is greater optimism for a clearer recovery in 2025, with Hamptons forecasting UK average price growth of 3% across the year. Key to this forecast is an expectation of continued interest rate reductions and improving buyer sentiment.
COMMERCIAL PROPERTY COMPARISON
Despite a period of falling prices in the residential market, the escalation of interest rates has impacted more significantly on the commercial property market. According to MSCI, over the 12 months to December 2023 average All Property (i.e. commercial property) values dropped by 3.3% whereas average UK residential values on the Land Registry measure fell by 1.4%.
OFFICES HIT HARD
However, there were significant differences in value movements between the key commercial property sectors. The office sector experienced the sharpest decrease in values, falling by 15% over 12 months to December 2023. This reflects increased perceptions of risk linked to the permanence of hybrid working in the wake of the pandemic and environmental remediation costs.

INDUSTRIAL STRENGTH
Of all the property sectors, including residential, industrial value growth has outperformed over the 12 months to December 2023 with growth of 2.7%. This is a complete turnaround from the position seen six months prior, where industrial capital values were down by a colossal 25% over 12 months to June 2023.
Despite the severe correction endured by the industrial sector, it remains the best performing asset class over the medium-term horizon. Over the past five years, the UK industrial sector has recorded capital growth of 5.3% p.a., running some way ahead of the 4.4% p.a. growth in UK residential values.
OFFICES ERODING PREMIUM
There has been a notable change in the relative per sq ft values between the sectors, most notably between offices and residential. The relative resilience of residential values vis-à-vis office values has seen a reversal in the premium typically associated with office values over residential. At the end of 2023, the average per sq ft value of residential properties in the ‘Big Six’ UK regional cities moved to a 0.6% premium over offices. This is a stark contrast with the position just three years ago, when office values in the Big Six held a 46% premium over residential.
The Berkshire town of Reading is one such location where average residential values now command a notable premium over average office values. While statistical evidence from MSCI is lacking for a wider range of locations, this pattern is increasingly being observed across the UK, most notably in the South East, East and outer London regions.

RENTAL GROWTH FORECAST
While values have fallen in the residential sales market generally, higher interest rates and ongoing lack of affordability continues to drive strong demand for private rented accommodation. Limited supply of rented housing alongside strong demand has driven strong rates of rental growth, a trend set to continue over the medium term. Indeed, Hampton’s latest research forecasts residential rental growth of 25% over the next four years, compared with only 5.5% growth in residential values.
The correction in parts of the commercial property market and the resilience of the private rented residential market will have an important bearing on investor decisions over the next cycle, funnelling an increasing share of capital into residential-led development. This is certainly true with regard to mixed-use developments and the burgeoning built to rent sector, with the relative changes in values between sectors playing a decisive role in decisions to allocate space between various uses.
Related service
Dig deeper with Bespoke reports
Using a combination of unique proprietary and open data sources, we are able to analyse local market activity and its influences across all price points and residential sectors.
Find out more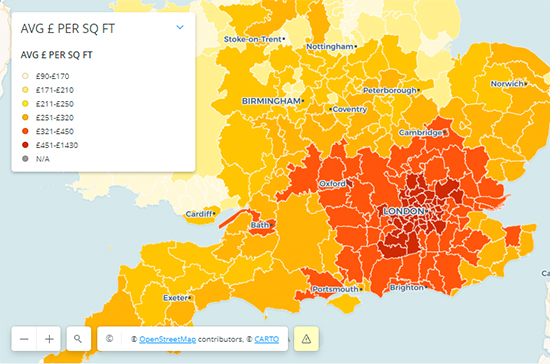
Housing solutions
We are uniquely placed to provide clients with a complete solution to help identify, unlock and realise a long term pipeline of residential development.
Specialist teams
- 574
-
574 is an online property trading platform offering a simple, certain and secure way to transact residential development and investment opportunities within the UK from anywhere in the world.
Our large online audience of over over 100,000 pre-verified buyers maximises the opportunity for best price through a seamless, transparent and trouble-free process.
Our success rate is 96% vs. c70% in the ballroom and our pre-verification process ensures that deposits are taken immediately.
Find out more - A3 Relocation Solutions
-
Disasters such as fire or flood can heavily damage or totally destroy homes and workplaces, rendering them incapable of occupation.
Our emergency relocation service enables insurance companies, brokers and loss adjusters to move policy holders to alternative accommodation while repairs or renovations are carried out.
Find out more - Airspace Exchange
-
An increasingly popular trend among property investors and freehold owners is the upward extension of existing buildings for residential use as a means of creating additional value.
We can undertake a review of the technical aspects of the property, such as structural integrity and detailed planning considerations, to determine the viability for airspace development, before taking it through the planning, construction and disposal process.
Find out more - LSH Residential
-
LSH Residential is an established property management company specialising in Leasehold, Block and Estate Management for over 15 years. Operating throughout the country, we work with many regional and national developers.
Find out more - ikon
-
ikon is a professional residential and mixed-use consultancy focused on providing an enhanced project management service to private, public and housing association clients working across the wider regeneration sector, including direct and joint venture delivery models.
Our team also specialises in brokering the sale of residential development projects to housing associations, thereby mitigating risk and maximising returns for all parties.
Find out more - LSH Investment Management
-
We deliver well-informed, market-facing investment thinking to institutional, family office and high net worth private clients.
Combining our long-term and trusted relationships with our 'hands on' approach to managing assets and enhancing value and income, we invest across the full spectrum of commercial property in the UK, building robust balanced portfolios and creating specialist strategies for higher return.
- Planning, Regeneration + Infrastructure
-
Our team of specialist planning, development, urban design, master planning and regeneration experts can help identify, appraise, unlock and maximise the development potential and value of complex urban and rural sites and buildings.


National Land Network
Our National Land Network operates extensively across the UK and offers expert advice on a variety of sites with potential for residential development.
Get in touch


Email me direct
To: